Experiment #10
DRAWDOWN CURVE FOR A SINGLE WELL IN AN UNCONFINED AQUIFER
Object: To draw a drawdown curve for a single well in an unconfined aquifer pumping at a constant rate.
Apparatus: Aquifers testing well pump system, flow meter, water level indicator, logger and stopwatch.
Theory:
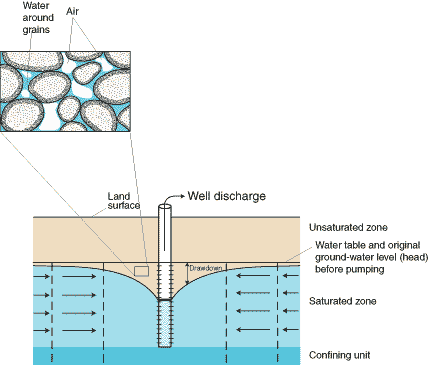
In subsurface hydrogeology, drawdown is the reduction in hydraulic head observed at a well in an aquifer, typically due to pumping a well as part of an aquifer test or well test.

A pumping test is a field experiment in which a well is pumped at a controlled rate and water-level response (drawdown) is measured in one or more surrounding observation wells and optionally in the pumped well (control well) itself; response data from pumping tests are used to estimate the hydraulic properties of aquifers, evaluate well performance and identify aquifer boundaries.Aquifer testandaquifer performance test(APT) are alternate designations for a pumping test. In petroleum engineering, a pumping test is referred to as adrawdown test.
It is important to conduct this drawdown measurement and understand the quality of work in of a well and to understand the geological situation of the aquifer itself.
For this we need to find drawdowns and pot it against distance to exactly understand the shape of curve and inject pumping shaft of the well in better way.
Procedure:
The draw down is observed in the field during constant discharge pumping test.
First, near a well pumping shaft mark points at 20 cm distance for 1m and then mark at 1 m distance for almost 5m or 10m of the pipe for observation.
At all those points you need to measure drop down. You can either use a sensor with data logger or use manual chalk method.
In manual chalk method you need to cover chalk in measuring tape and drop it down into bore hole areas marked and then stop lowering it when water is felt.
We need to read and record that reading of tape and pull tape backup. We then need to see mark on tape to see length of tape that went inside water surface.We need to deduct that value from actual depth recorded from tape.
We then need to measure head at a location with no dropdown.so need to check at a heavy distance from well and then note this depth as ground thickness.
Deduct this ground thickness from all the measuring tape readings to get actual dropdown.
The data obtained from pumping test is plotted against time to obtain the drawdown curve using time drawdown method.
Then plot a graph of draw down (y-axis) against distance from well (x-axis).
Observation Tables:
Pumping Rate (m3/sec) | |
Distance of Observation wells (m) | |
Static GW Level (m) |
Time (min) | Drawdown (m) |
Graphs:
The data obtained from pumping test is plotted against time to obtain the drawdown curve using time drawdown method.
Results:
