Practical Guide: Georeferencing in ArcMap
1. Introduction
Georeferencing is the process of aligning spatial data (like scanned maps or aerial photographs) to a known coordinate system. This guide will walk you through the steps to georeference an image in ArcMap.
2. Getting Started
- Open ArcMap: Launch ArcMap and create a new project.
- Add Basemap: It can be helpful to have a basemap for reference.
- Click on the
Add Databutton and select a basemap (e.g., a current map of the area).
3. Adding the Raster Image
- Add the Image:
- Click the
Add Databutton. - Browse to your scanned map or image file (e.g., TIFF, JPEG) and add it to your map.
4. Opening the Georeferencing Toolbar
- Enable Georeferencing Toolbar:
- Go to
Customize > Toolbars > Georeferencing. - The Georeferencing toolbar will appear.
5. Setting the Coordinate System
- Define the Coordinate System:
- Right-click on the raster layer in the Table of Contents.
- Select
Properties. - Go to the
Sourcetab and click onDefine Projectionif the coordinate system is not set. - Choose the appropriate coordinate system for your data.
6. Georeferencing the Image
A. Fit to Display
- Fit to Display:
- On the Georeferencing toolbar, click the drop-down arrow next to
Georeferencingand selectFit to Display. - This will position your image within the current view.
B. Add Control Points
- Add Control Points:
- Click on the
Add Control Pointsbutton on the Georeferencing toolbar. - Click on a known location on the raster image.
- Click on the corresponding location on the basemap to create a control point pair.
- Repeat this process for at least 4-5 points distributed across the image for better accuracy.
C. Adjust Control Points
- View Control Points:
- Click on the
View Link Tablebutton to see the control points you’ve created. - Check the Residual Error for each point; aim for low values for better alignment.
- Edit Control Points:
- If a control point is inaccurate, you can delete it from the Link Table and add a new one.
7. Transforming the Image
- Update Georeferencing:
- Once satisfied with the control points, click on the
Update Georeferencingbutton on the toolbar. - This will apply the transformations and align the image with the coordinate system.
8. Saving the Georeferenced Image
- Export the Georeferenced Raster:
- Right-click on the raster layer in the Table of Contents.
- Select
Data > Export Data. - Choose the output format (e.g., TIFF) and ensure the option for “Use the same coordinate system as the data frame” is selected.
- Click
OKto save the georeferenced image.
9. Finalizing Your Work
- Save Your Project:
- Click
File > Save Asto save your ArcMap project (.mxd file).
10. Conclusion
You have successfully learned how to georeference an image in ArcMap, including adding control points, transforming the image, and exporting the georeferenced data.
Or
Introduction
There is a great deal of geographic data available in formats that can not be immediately integrated with other GIS data. In order to use these types of data in GIS it is necessary to align it with existing geographically referenced data, this process is also called georeferencing. Georeferencing is also a necessary step in the digitizing process. Digitizing in GIS is the process of “tracing”, in a geographically correct way, information from images/maps. The process of georeferencing relies on the coordination of points on the scanned image (data to be georeferenced) with points on a geographically referenced data (data to which the image will be georeferenced). By “linking” points on the image with those same locations in the geographically referenced data you will create a polynomial transformation that converts the location of the entire image to the correct geographic location. We can call the linked points on each data layer control points.
The selection of control points is important. Some guidelines:
- They should be easy to confirm as representing the same geographic location (street intersection, political boundary, landmark, etc.).
- They should be spread across the image to be registered; one suggestion is to select a control point near each of the corners of the image and few throughout the interior will often work well.
- Good overlap between the two dataset is also important.
- Make sure you are clicking as close as possible to the same geographic location, zooming in can help in this process.
As you add points the complexity of the transformation that is possible increases. This is not always a good thing, 1st, 2nd, and 3rd order polynomials can be calculated, usually a 1st or 2nd order transformation is all that is necessary. In order to complete a 1st order transformation you need a minimum of three control points, for a 2nd order you need a minimum of six control points, and for a 3rd order you will need a minimum of ten points. A 1st order transformation will shift, scale, and rotate your image while 2nd and 3rd order transformations will bend and curve straight lines, which might be necessary, but is rare.
Data:
Three file will be used in this training module, NYStreet.shp, ManhattenCensus.shp, and Manhattan.sid. The latter is a raster image of the same type as jpeg, gif, tiff, etc.; it’s just a digital picture at this point. The first file is a shapefile that contains the street map for the entire state of NY; the second is a layer that contains only the census tracts and extent for Manhattan, which will be useful for zooming to and initially coordinating the image. The first thing you are going to do is “Clip” the part of the street map that intersects Manhattan. The street layer will be used for setting control points.
Creating a New Layer by Clipping
Open Both layers (NYStreet and ManhattanCensus).
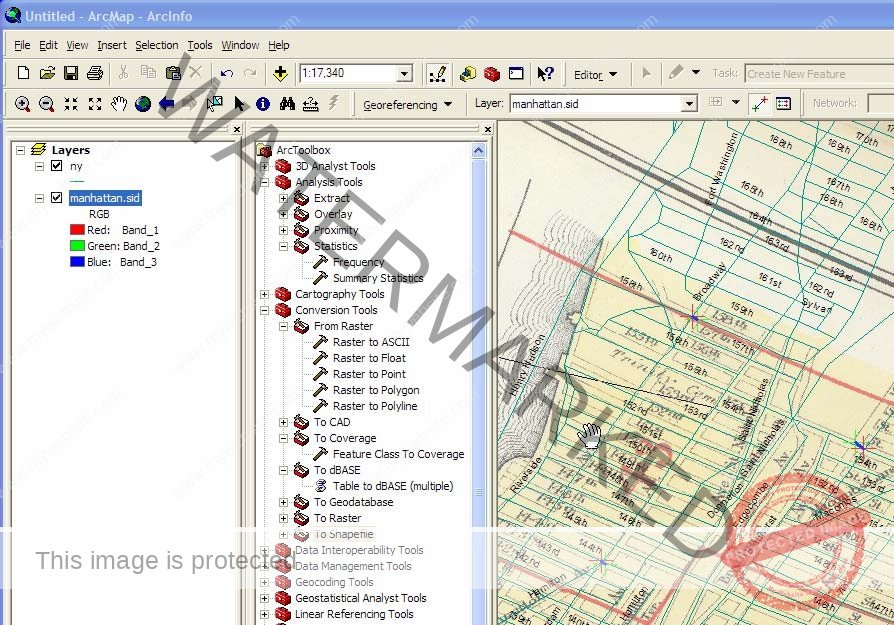
Open ArcToolBox (red toolbox on menu) and open Analysis Tools, then Extract. Choose the clip tool.
The input feature is the street map.
The clip feature is the census tracts of Manhattan.
The output class should go somewhere you can find it and be named something you will recognize (ManhattanStreet.shp as an example).
Don’t worry about cluster tolerances. Click Ok.
Add the new layer and remove the original street layer.
Georeferencing/Registering an Image
Tools:
The primary tool we will be using is the georeferencing toolbar
The georeferencing toolbar is probably not visible when you first open ArcGIS, you can open it be clicking on view, selecting toolbars, then activating the georeferencing toolbar option.
Add the manhattan.sid file.
Right click the shapefile (not image) and “Zoom to Layer,” this is a nice feature you might have used before that let us get to the geographic extent of a specific data layer quickly.
From the georeferencing toolbar, click the “Layer” dropdown arrow and select the manhattan.sid image name.
Click “Georeference” and select “Fit to Display” from the dropdown.
This will display the image in the same general space as the manhattan census tracts layer.
Before adding control points you should move the image around a bit to get it closer to the orientation and position of the GIS layers you are using.
Use the Rotate and Shift tools for this.

Now you are read to add control points. Click on the control points tool.
You should be using the clipped data for linking, and use the labels too. (Right click the layer and select label features).
To add a link, click the mouse on the image first, then on a known location on the GIS database. You can use the magnify tools to get a close look at subsets of the data.
You can also turn on the effect toolbar to change the transparency to see both layers at once if you like, or you can turn the layers off and one as you select points from each.
Once you’ve added a few links you can open the link table to see how each has worked.
View Link Table is the final icon on the right of the georeferencing toolbar.

In the link table you can view the Total RMS Error as well as the residual for each link that contributes to the overall Total. The errors are associated with the amount of disagreement between the two control points for each link once the transformation is set (once you’ve added more than three links). You have to be sure that the two points that are linked are the same place in world (same street intersection for instance), as you could have a very low error and residuals but not have an accurately registered image.
Once you are satisfied with the registration, and you can delete links or start all over by deleting them all, you can Update Georeferencing, this will save your transformation. This process will add a .aux file that contains information about the transformation that is necessary to view this file in the future with other data.
Don’t forget to save your work, save your map as “xxx”.mxd.